If you’ve used built-in charts in .NET framework, you’d realize they’re a bit limited in their functionality and are not very flexible. An excellent alternative is the free OxyPlot library that enables you to add advanced graphical plotting capability to your application.
The following steps outline how to use OxyPlot in a Windows Forms application:
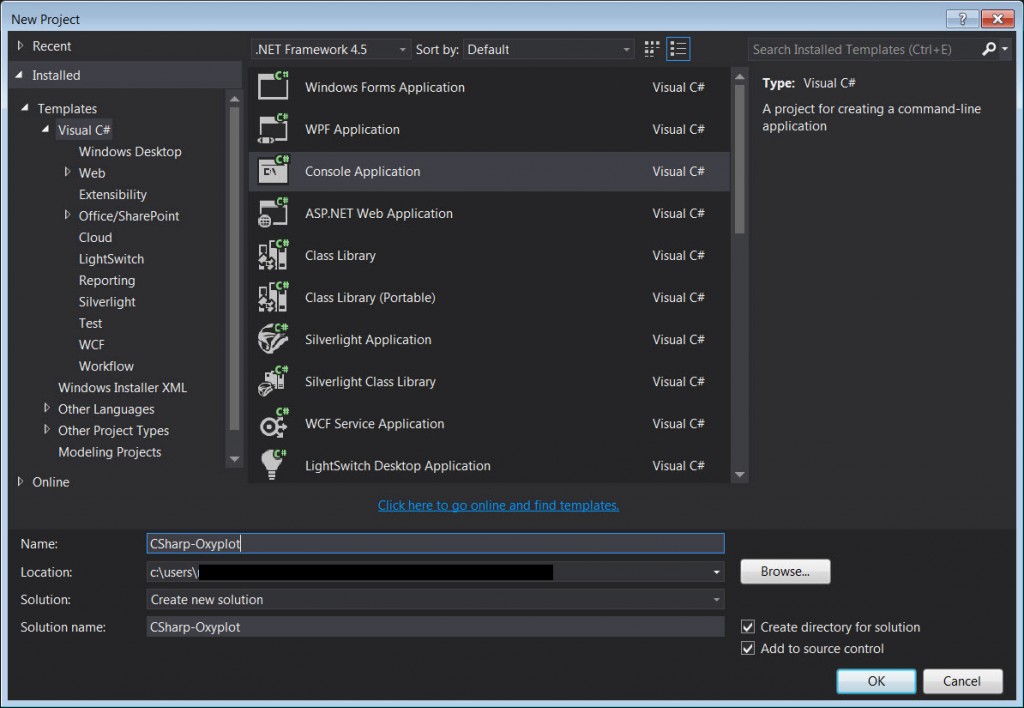
1. Create a new Windows Forms application. We use C# as the programming language here.
2. Add reference to the required OxyPlot libraries. Simply go to Tools>>NuGet Package Manager>>Package Manager Console
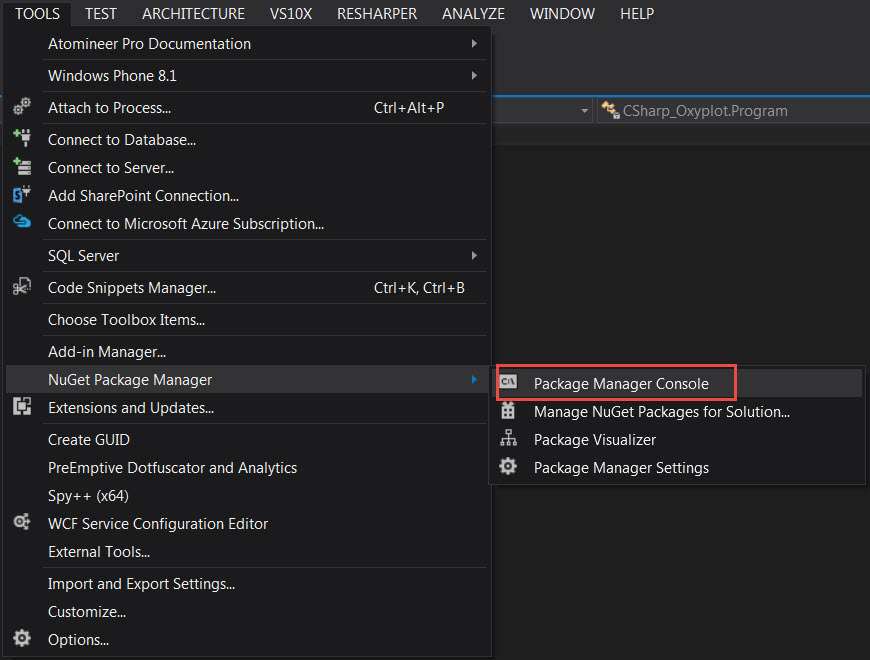
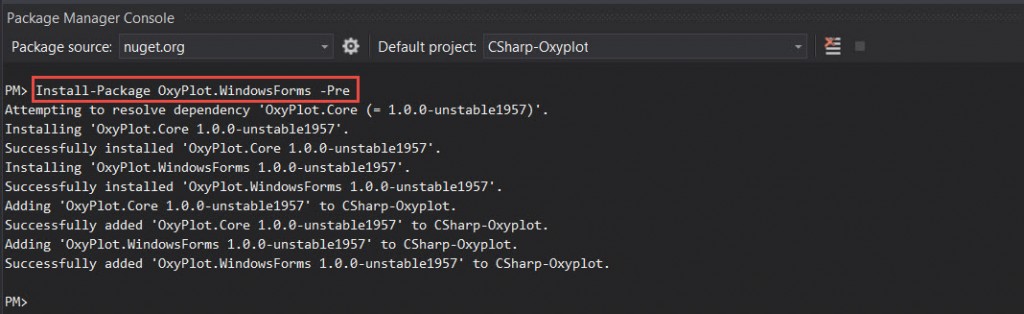
In the Package Manager Console, type:
Install-Package OxyPlot.WindowsForms
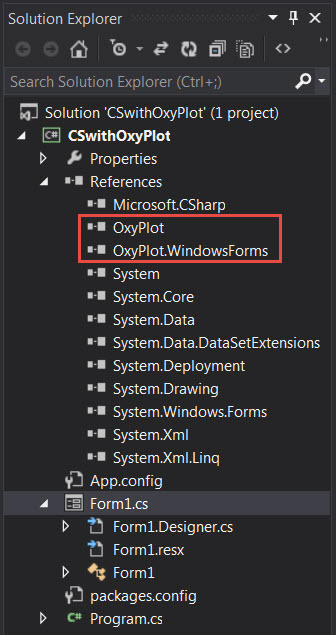
3. Verify that the libraries show up under references
4. Now let’s add some code. Note the required ‘using’ directives:
using OxyPlot;
using OxyPlot.Series;
using OxyPlot.WindowsForms;

namespace CSwithOxyPlot
{
    public partial class Form1 : Form
    {
        public Form1()
        {
            InitializeComponent();

            //Create Plotview object
            PlotView myPlot = new PlotView();

            //Create Plotmodel object
            var myModel = new PlotModel { Title = "Simple Plot" };
            myModel.Series.Add(new FunctionSeries(Math.Sin, 0, 10, 0.1, "sin(x)"));

            //Assign PlotModel to PlotView
            myPlot.Model = myModel;

            //Set up plot for display
            myPlot.Dock = System.Windows.Forms.DockStyle.Bottom;
            myPlot.Location = new System.Drawing.Point(0, 0);
            myPlot.Size = new System.Drawing.Size(500, 500);
            myPlot.TabIndex = 0;

            //Add plot control to form
            Controls.Add(myPlot);
        }
    }
}
5. Here’s the output, which isn’t too bad:


Hi,
Thanks a lot for the example.
After struggling to get Oxyplot works on WPF I resigned and created a WinForm under a WPF project and your tutorial was very helpful.
I changed the FunctionSeries to some fixed points since it will later suits my need better.
‘myModel.Series.Add(New FunctionSeries(Math.Sin, 0, 10, 0.1, “sin(x)”))
Dim fs As New FunctionSeries()
fs.Points.Add(New DataPoint(0, 4))
fs.Points.Add(New DataPoint(10, 1))
fs.Points.Add(New DataPoint(20, 12))
myModel.Series.Add(fs)
Thanks again!
Thank you very much. Finally something ehat helped me instead of few bad tutorials… :)